Financial Highlights
- Changes in business results and profitability
- Changes in financial position and efficiency
- Indicators per share
Changes in business results and profitability
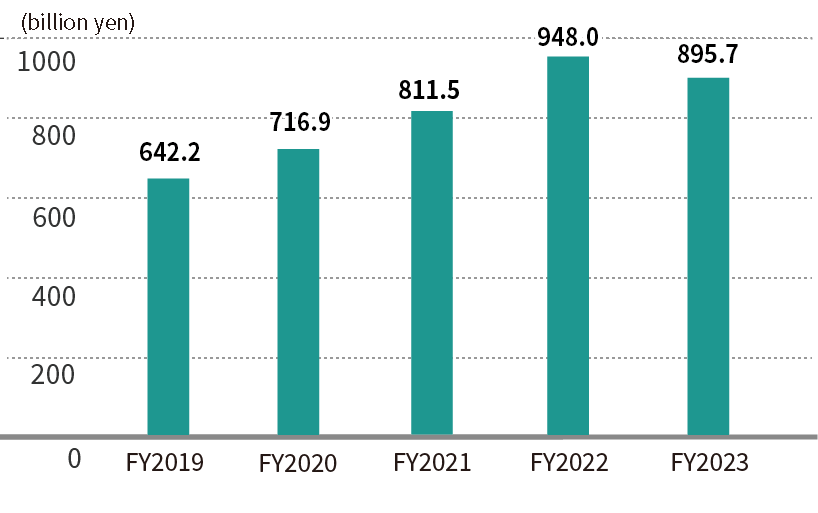
Net sales
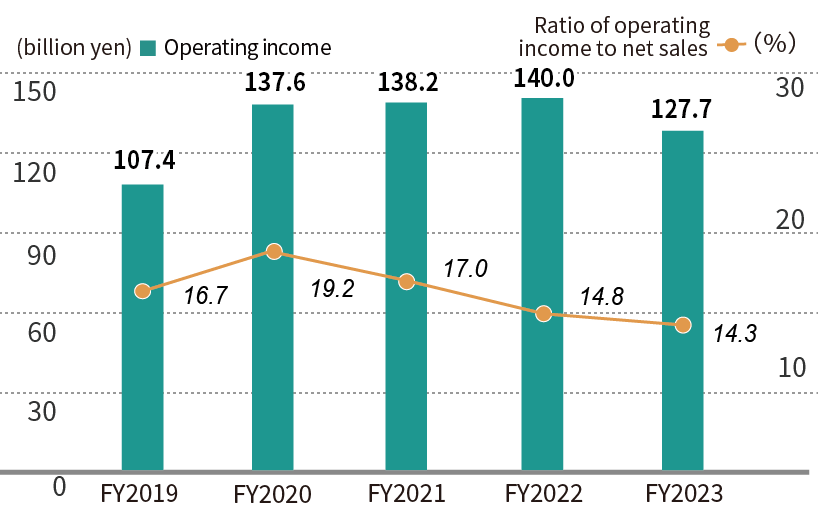
Operating income/Ratio of operating income to net sales
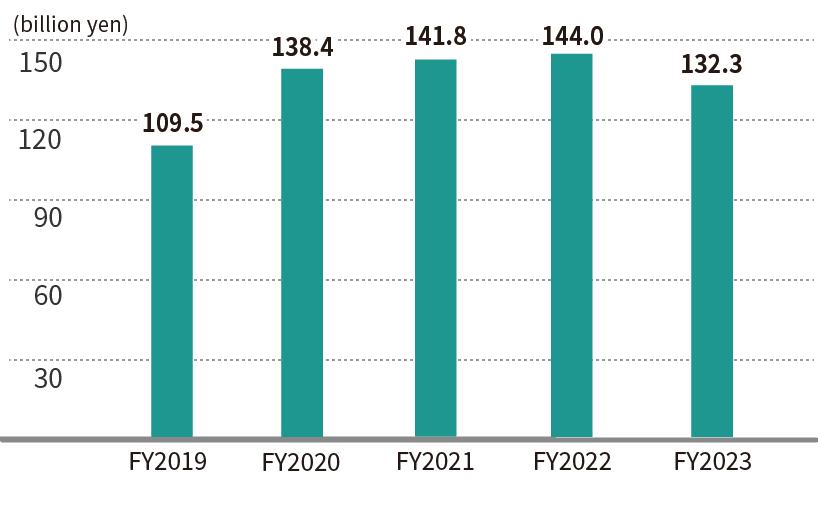
Ordinary income
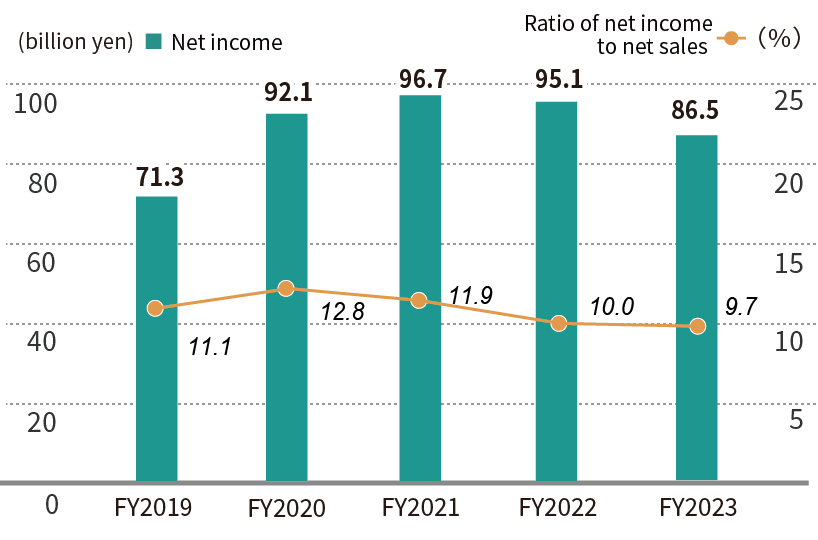
Net income/Ratio of net income to net sales
[Unit: million yen]
| FY2020 | FY2021 | FY2022 | FY2023 | FY2024 | |
|---|---|---|---|---|---|
| Net sales | 716,900 | 811,581 | 948,094 | 895,799 | 928,950 |
| Operating income | 137,687 | 138,270 | 140,076 | 127,725 | 120,372 |
| Ordinary income | 138,426 | 141,847 | 144,085 | 132,377 | 126,218 |
| Net income | 92,114 | 96,724 | 95,129 | 86,523 | 76,891 |
|
Ratio of operating income to net sales [Unit: %] |
19.2 | 17.0 | 14.8 | 14.3 | 13.0 |
|
Ratio of net income to net sales [Unit: %] |
12.8 | 11.9 | 10.0 | 9.7 | 8.3 |
Changes in financial position and efficiency
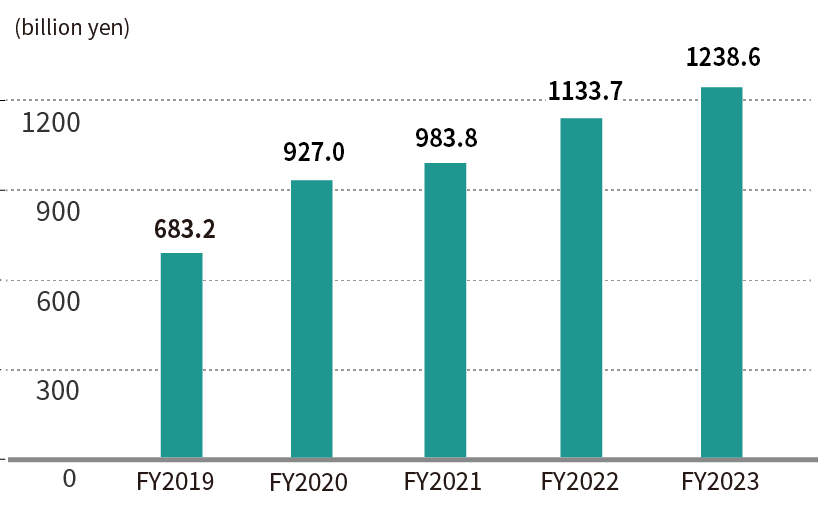
Total assets
Net assets

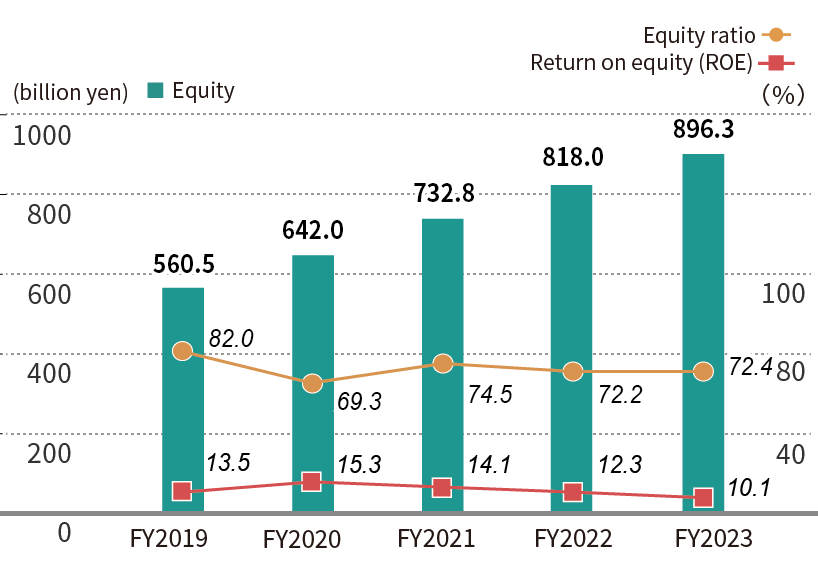
Equity/ Equity ratio/Return on equity (ROE)
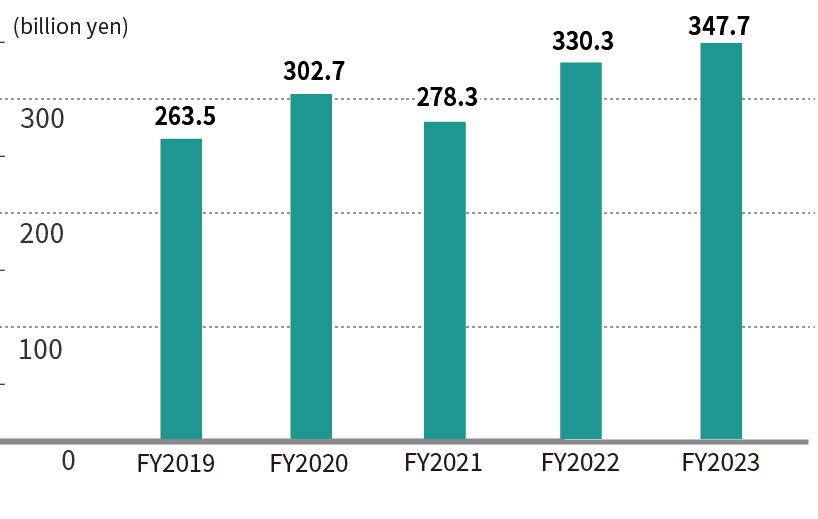
Current assets
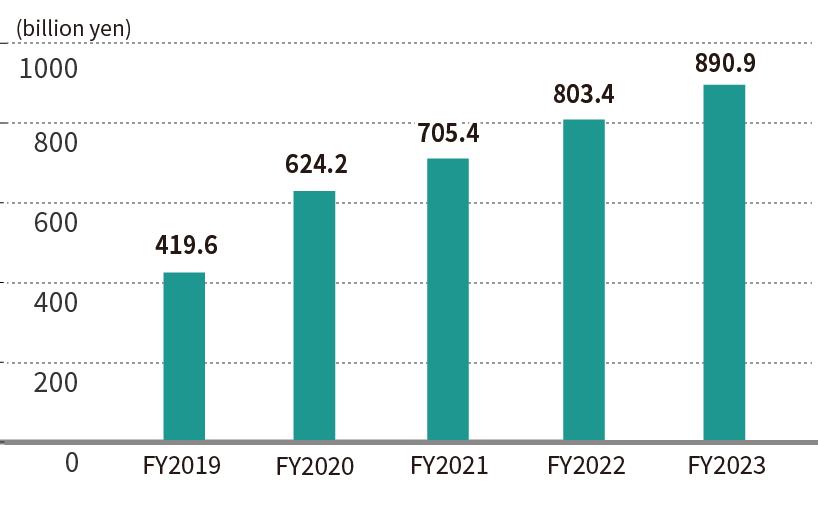
Non-current assets
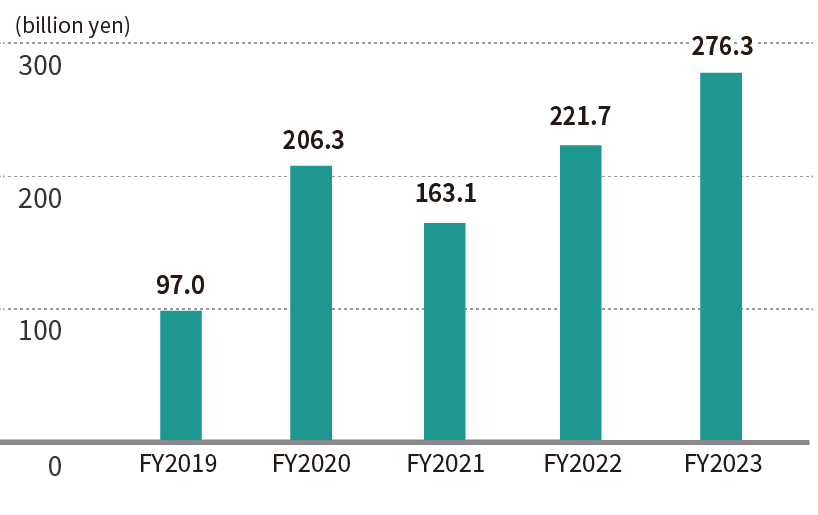
Current liabilities
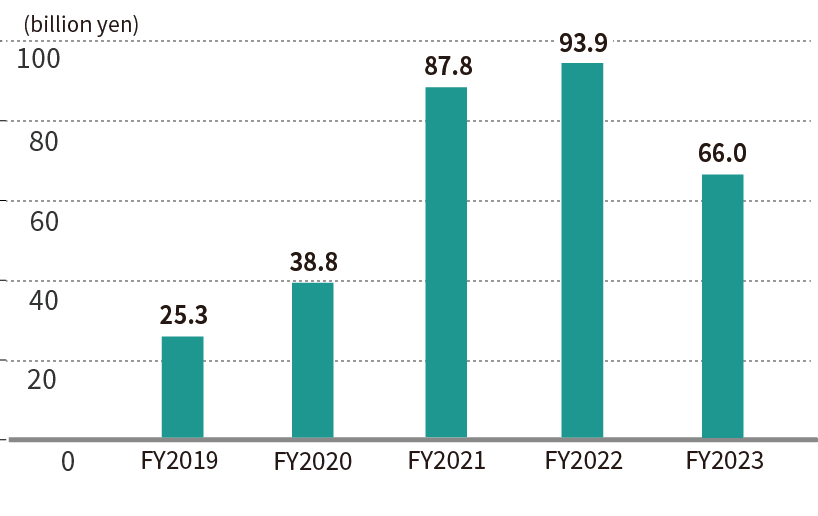
Non-current liabilities
[Unit: million yen]
| FY2020 | FY2021 | FY2022 | FY2023 | FY2024 | |
|---|---|---|---|---|---|
| Total assets | 927,048 | 983,840 | 1,133,771 | 1,238,679 | 1,350,631 |
| Net assets | 681,857 | 732,813 | 818,096 | 896,308 | 965,352 |
| Equity | 642,096 | 732,813 | 818,096 | 896,304 | 965,352 |
| Current assets | 302,750 | 278,367 | 330,353 | 347,736 | 370,834 |
| Non-current assets | 624,205 | 705,472 | 803,417 | 890,942 | 979,796 |
| Current liabilities | 206,345 | 163,181 | 221,769 | 276,336 | 319,775 |
| Non-current liabilities | 38,844 | 87,845 | 93,905 | 66,033 | 65,502 |
|
Equity ratio [Unit: %] |
69.3 | 74.5 | 72.2 | 72.4 | 71.5 |
|
Return on equity (ROE) [Unit: %] |
15.3 | 14.1 | 12.3 | 10.1 | 8.3 |
- Equity = net assets - (subscription rights to share + Non-controlling interests)
- Equity ratio = equity (at the end of the fiscal year)/total assets (at the end of the fiscal year) x 100
- Return on equity (ROE) = net income/ equity (average during the fiscal year) x 100
Indicators per share
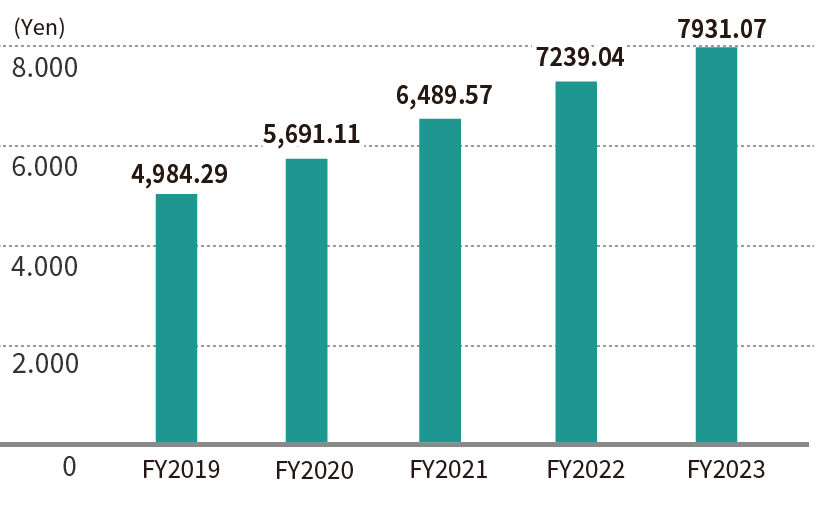
Net assets
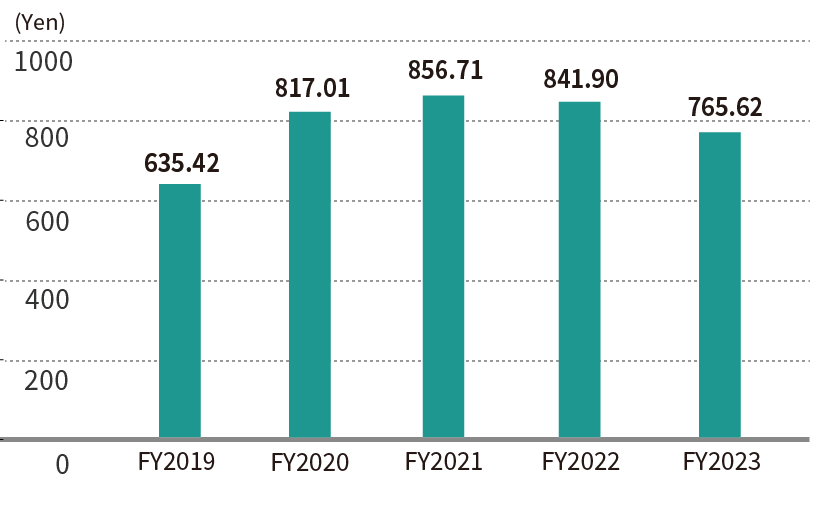
Net income
Dividends
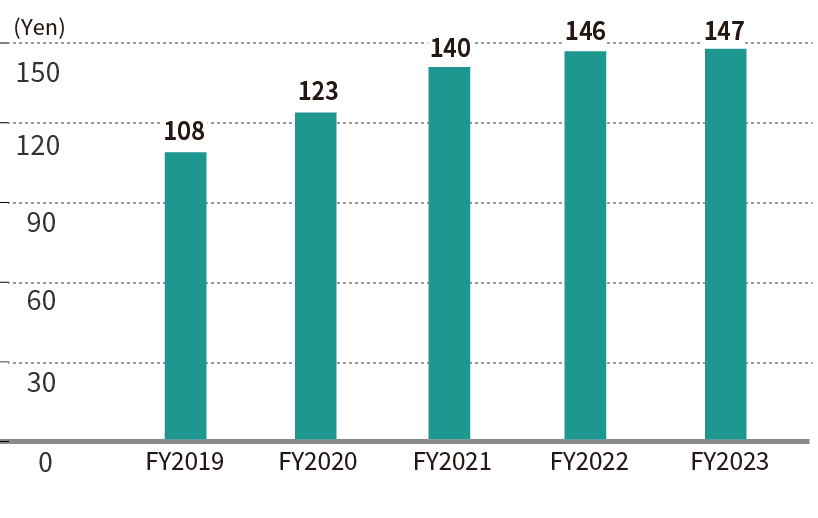
[Unit: yen]
| FY2020 | FY2021 | FY2022 | FY2023 | FY2024 | |
|---|---|---|---|---|---|
| Net assets | 5,691.11 | 6,489.57 | 7,239.04 | 7,931.07 | 8,542.07 |
| Net income | 817.01 | 856.71 | 841.90 | 765.62 | 680.38 |
| Dividends | 123 | 140 | 146 | 147 | 152 |
The forecasts and projected operating results contained in this report are based on information available at the time of preparation, and thus involve inherent risks and uncertainties.
Accordingly, readers are cautioned that actual results may differ materially from those projected as a result of a variety of factors.
![]()
Adobe Reader is required for reading documents in the PDF format.
Please download it from. Adobe System Inc.